ADVERTISEMENT
Charts & Stock Market Analysis
Finance
![]() 4.3
4.3![]() 10K+
10K+
Editor's Review
Statmetrics is a comprehensive solution for stock market analysis, portfolio analytics, investment management and research. Stay on top of the markets and access global market news, economic and real-time financial data from global stock exchanges. Forecast market trends and cycles with advanced charting and technical analysis. Construct, backtest and manage multiple portfolios and streamline your risk management with the integrated portfolio analytics solution. Analyze the fundamental and quantitative characteristics of portfolio or potential investments and gain insight into the risk-return profile of your investments. Track overall performance of your portfolio across all accounts in one place and evaluate your investment strategy. Enhance your investment research, explore investment opportunities and identify hidden risks that affect your investments with a comprehensive suite of analytical tools and financial models.
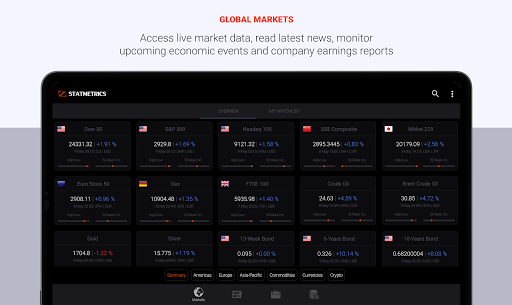
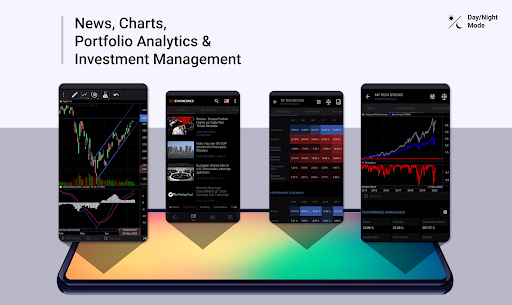
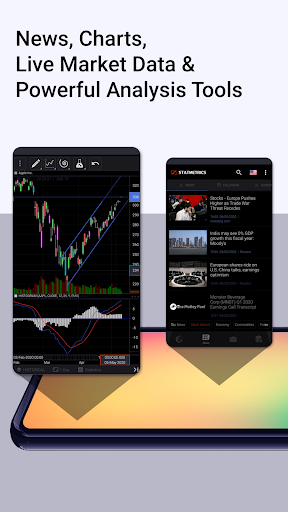
GLOBAL MARKETS & FINANCIAL NEWS
- Live quotes and charts for major financial instruments (indices, stocks, bonds, mutual funds, ETFs, commodities, currencies, crypto, interest rates, futures and options), traded on global exchanges.
- Market screener for searching equities, funds and ETFs by user-defined search parameters.
- Personalized watchlists and notepad for storing trading ideas.
- Calendar for economic events and company earnings reports.
- Financial news coverage for multiple regions and languages
- Integrated RSS-Reader and news feed subscription by the user.
- Search for news headlines and Google Trends statistics by specific keywords.
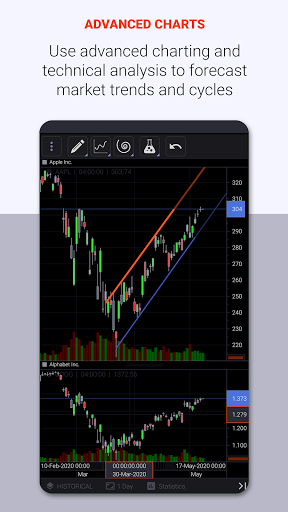
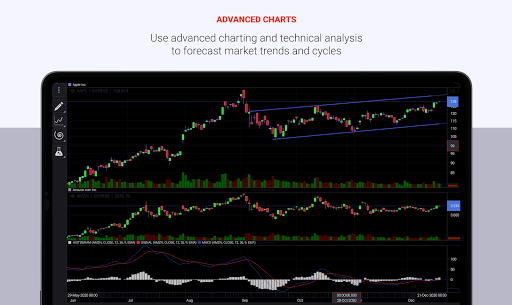
CHARTING & TECHNICAL ANALYSIS
- Interactive high-performance charting and broad range of drawing tools.
- Large set of commonly used technical indicators.
- Custom Templates for intraday and historical charts.
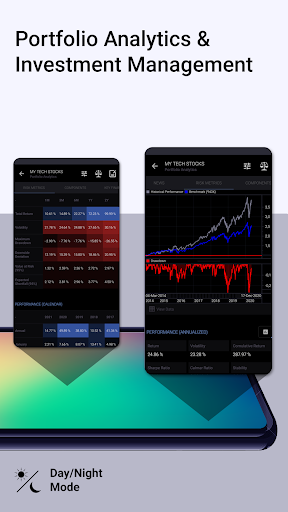
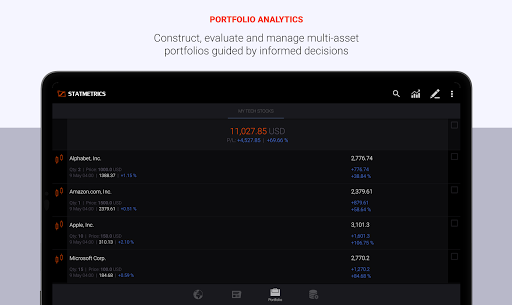
PORTFOLIO ANALYTICS & INVESTMENT RESEARCH
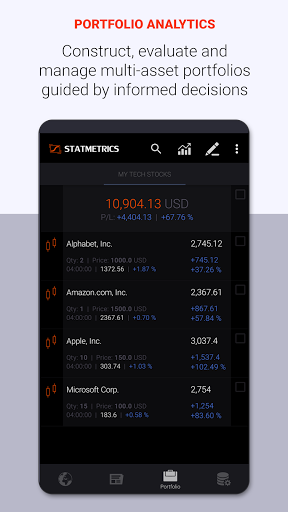
- Portfolio performance tracking and analysis of investment strategies based on trading history
- Construction, backtesting and management of multi-currency and long-short portfolios.
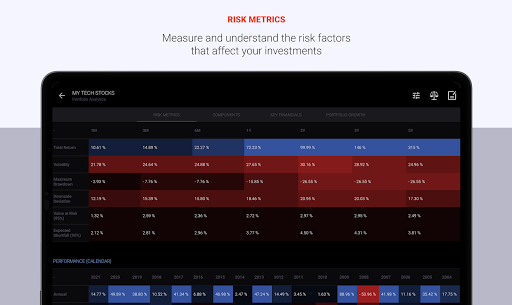
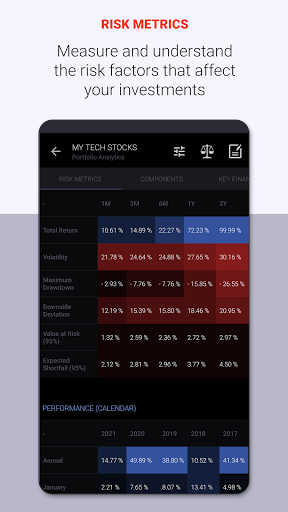
- Fundamental and quantitative performance and risk analysis of portfolio and its components.
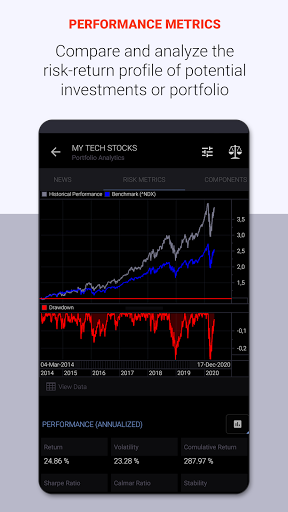
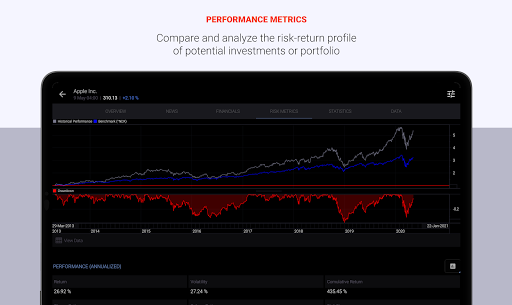
- Measuring performance vs. benchmark and calculation of investment risk indicators (return, volatility, Sharpe ratio, maximum drawdown, value-at-risk, expected shortfall, alpha, beta, information ratio, etc.).
- Analysis of stress events, drawdowns and measuring of historical and modified value-at-risk.
- Evaluation of asset allocation, sector allocation, correlations and portfolio risk decomposition.
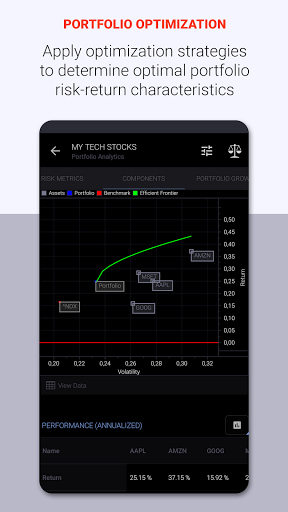
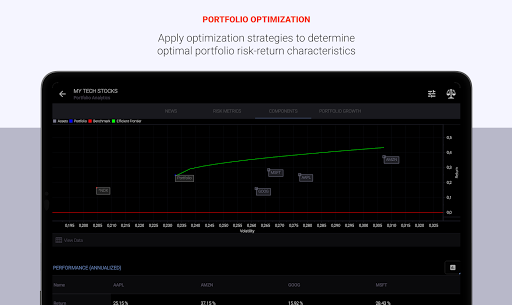
- Visualization of security market line, security characteristic line, efficient frontier and rolling investment risk indicators.
- Predefined mean-variance portfolio optimization strategies (minimum variance, maximum diversification, maximum decorrelation, equal risk contribution, etc.).
- Fundamental analysis of income statement, balance sheet, cash-flow statement, institutional holders, mutual fund holders, company profiles and visualization of key financial ratios.
- Evaluation of fundamental factors such as per share data, valuation ratios, profitability, growth, leverage, liquidity, dividend growth and dividend history.
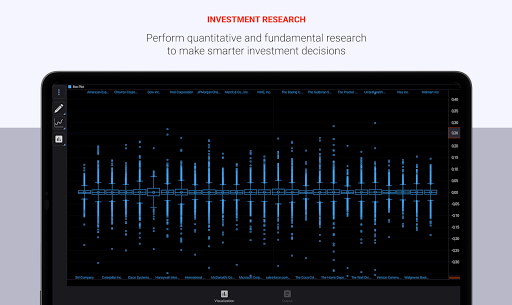
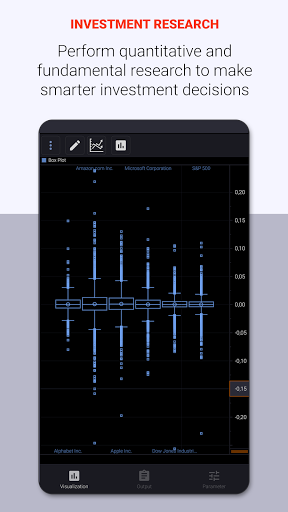
- Calculation of group descriptive statistics for single assets, portfolio or a watchlist.
- Statistical visualization and hypothesis testing (unit root test, Granger causality test, etc.).
- Correlation, cointegration, regression and principal component analysis.
FINANCIAL AND ECONOMIC DATA (DIRECT ACCESS)
- IEX Stock Exchange (U.S. stocks)
- Alpha Vantage (stocks, forex and cryptocurrencies)
- Barchart.com (stocks, futures and forex)
- Cryptocompare.com (crypto currencies)
- Stooq.com (stocks, indices, currencies, bonds, commodities)
- Tiingo.com (ETFs, Mutual Funds, and Chinese A-Shares)
- Quandl.com (economic data): Central Bank of Japan, Bank of England, Deutsche Bundesbank, European Central Bank Data (ECB), Federal Reserve Economic Data (FRED), World Bank, International Monetary Fund (IMF) and OECD.
ADVERTISEMENT
Screenshots